---
title: "MAPK signaling and lineage identity in histological transformation -- Figures S9D, S9G"
execute:
warning: false
error: false
format:
html:
code-fold: true
code-tools: true
toc: true
---
Reanalysis of bulk RNA-seq (TPM) from two published transformation cohorts, both
EGFR-agnostic: neuroendocrine transformation (Quintanal-Villalonga et al., *Cancer Discov*
2021) and squamous transformation (Quintanal-Villalonga et al., *J Hematol Oncol*
2021. Samples are scored for LUAD / LUSC / SCLC lineage identity and for
MAPK / EGFR pathway activity with GSVA, then compared within patient and correlated
across samples.
| panel | output |
|---|---|
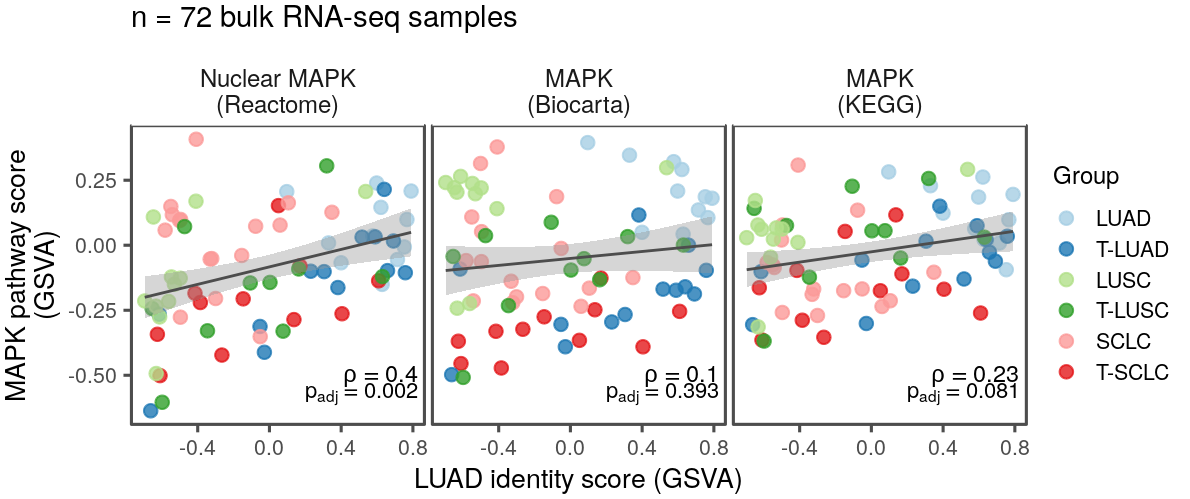
| **S9D** | `plots/luad_vs_mapk_scatter.pdf` -- LUAD identity against the three core MAPK scores |
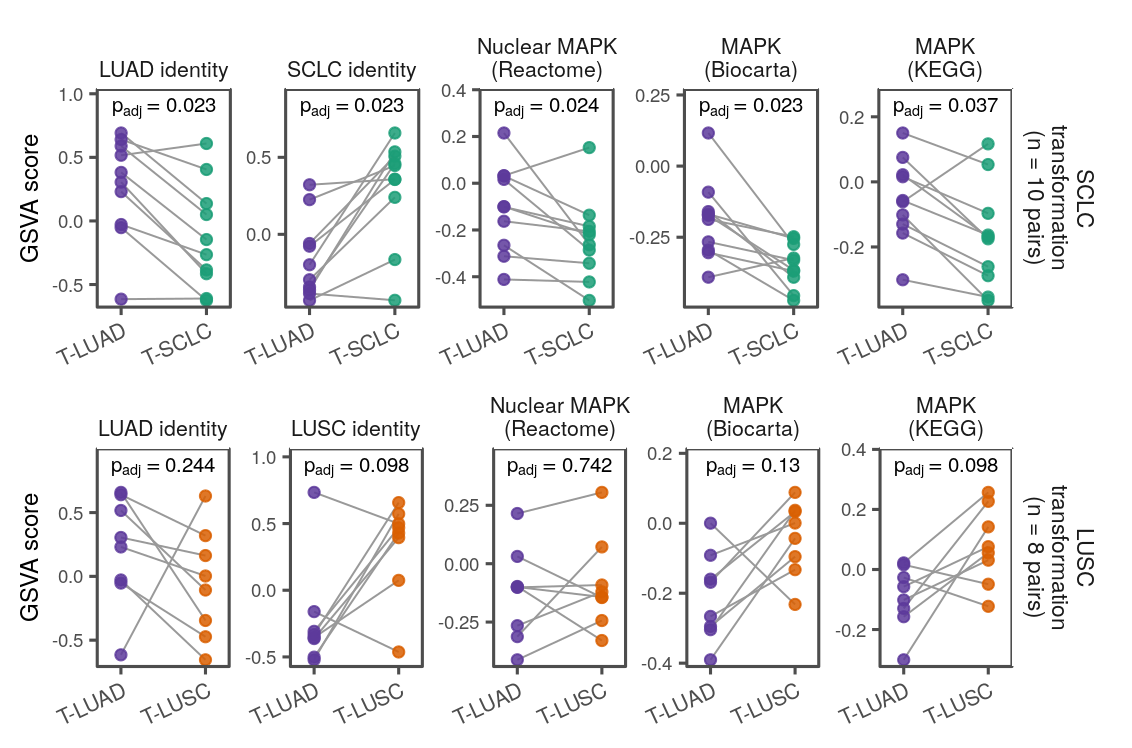
| **S9G** | `plots/paired_core_stacked.pdf` -- within-patient paired change, both cohorts stacked |
Sample groups, in both cohorts: `LUAD` (control), `T-LUAD` (the LUAD component of a
transforming tumour, or the pre-transformation biopsy) and the post-transformation component
-- `T-SCLC` in the NE cohort, `T-LUSC` in the squamous cohort -- plus de novo `SCLC` and
`LUSC`.
Run `00_download_convert.qmd` first to build `paper_data/`.
## Setup
```{r setup}
library(tidyverse)
library(here)
library(GSVA)
library(ggthemes)
library(patchwork)
library(broom)

plot_dir <- here("plots")
dir.create(plot_dir, showWarnings = FALSE)

# BH-adjust p-values (respects any active grouping)
add_padj <- function(df, p_col = "p.value") {
  df |> mutate(p_adj = p.adjust(.data[[p_col]], method = "BH"))
}

# Format BH-adjusted p-values for plot annotations (parsed as plotmath)
format_padj <- function(p, threshold = 0.001) {
  case_when(
    p < threshold ~ "p[adj]<0.001",
    TRUE ~ sprintf("p[adj]==%.3f", p)
  )
}
```
## Load and merge the two cohorts
```{r load-data}
lusc <- readxl::read_excel(path = here("paper_data", "bulk_squamous_transformation_tpm.xlsx"))
ne <- readxl::read_excel(path = here("paper_data", "bulk_ne_transformation_tpm.xlsx"))
```
Excel auto-converted some gene symbols to dates in `lusc`; fix these, then drop the
irreconcilable duplicates.
```{r clean-genes}
fix_gene_dates <- function(x) {
  case_when(
    str_detect(x, "^\\d{1,2}-Mar$") ~ paste0("MARCH", str_extract(x, "^\\d{1,2}")),
    str_detect(x, "^\\d{1,2}-Sep$") ~ paste0("SEPT", str_extract(x, "^\\d{1,2}")),
    str_detect(x, "^\\d{1,2}-Dec$") ~ paste0("DEC", str_extract(x, "^\\d{1,2}")),
    TRUE ~ x
  )
}

lusc <- lusc |>
  mutate(Gene = fix_gene_dates(Gene)) |>
  filter(!Gene %in% c("MARCH1", "MARCH2"))
```
For the 18 samples present in both files, take the `ne` values -- the newer file, unaffected by
the gene-name corruption. Restrict to genes present in both.
```{r merge}
shared_samples <- setdiff(intersect(colnames(lusc), colnames(ne)), "Gene")
shared_genes <- intersect(lusc$Gene, ne$Gene)
lusc_unique_samples <- setdiff(colnames(lusc), c(colnames(ne), "Gene"))
ne_unique_samples <- setdiff(colnames(ne), c(colnames(lusc), "Gene"))

ne_common <- ne |> filter(Gene %in% shared_genes) |> arrange(Gene)
lusc_common <- lusc |> filter(Gene %in% shared_genes) |> arrange(Gene)
stopifnot(identical(ne_common$Gene, lusc_common$Gene))

merged <- bind_cols(
  ne_common |> select(Gene, all_of(shared_samples), all_of(ne_unique_samples)),
  lusc_common |> select(all_of(lusc_unique_samples))
) |>
  mutate(across(-Gene, as.numeric))
```
## Pathway gene sets
```{r pathways}
pathways_v2 <- read.table(here("paper_data", "egfr_pathways_v2.txt"), header = TRUE, sep = "\t")
meta_programs_df <- read.csv(here("paper_data", "tirosh_mps_67_natcan_2025.csv")) |>
  rename(pathway = Geneset)

pathways_full <- bind_rows(pathways_v2, meta_programs_df[, c("Gene", "pathway")])
pathways_full$pathway[pathways_full$pathway == "LUAD_GIRARD"] <- "LUAD"
pathways_full$pathway[pathways_full$pathway == "LUSC_GIRARD"] <- "LUSC"
pathways_full$pathway[pathways_full$pathway == "SCLC_CCLE"] <- "SCLC"
```
## GSVA scoring
Checkpointed to disk; delete `gsva_f` to force a recompute after changing the expression
matrix or the gene sets.
```{r gsva}
expr_mat <- merged |>
  column_to_rownames("Gene") |>
  as.matrix()

gene_sets <- split(pathways_full$Gene, pathways_full$pathway)

gsva_f <- here("paper_data", "bulk_tluad_gsva_scores.rds")

if (!file.exists(gsva_f)) {
  gsva_scores <- gsva(gsvaParam(expr_mat, gene_sets), verbose = FALSE)
  dir.create(dirname(gsva_f), recursive = TRUE, showWarnings = FALSE)
  readr::write_rds(gsva_scores, file = gsva_f)
} else {
  gsva_scores <- readRDS(gsva_f)
}
```
## Sample groups and pathway score tables
Group is read off the column name; the `T-` prefix marks the transforming tumours.
```{r sample-groups}
type_levels <- c("LUAD", "T-LUAD", "LUSC", "T-LUSC", "SCLC", "T-SCLC")

sample_type <- case_when(
  str_detect(colnames(gsva_scores), "^T-LUAD") ~ "T-LUAD",
  str_detect(colnames(gsva_scores), "^T-LUSC") ~ "T-LUSC",
  str_detect(colnames(gsva_scores), "^T-SCLC") ~ "T-SCLC",
  str_detect(colnames(gsva_scores), "LUAD") ~ "LUAD",
  str_detect(colnames(gsva_scores), "LUSC") ~ "LUSC",
  str_detect(colnames(gsva_scores), "SCLC") ~ "SCLC",
  TRUE ~ NA_character_
)
```
Five MAPK/EGFR gene sets are scored. Both panels use `core_mapk`, the three that are not
EGFR-specific.
```{r mapk-scores}
short_names <- c(
  "REACTOME_MAPK_TARGETS_NUCLEAR_EVENTS_MEDIATED_BY_MAP_KINASES" = "Nuclear MAPK\n(Reactome)",
  "BIOCARTA_MAPK_PATHWAY" = "MAPK\n(Biocarta)",
  "KEGG_MAPK_SIGNALING_PATHWAY" = "MAPK\n(KEGG)",
  "REACTOME_MAPK_FAMILY_SIGNALING_CASCADES" = "MAPK Cascades\n(Reactome)",
  "REACTOME_SIGNALING_BY_EGFR" = "EGFR Signaling\n(Reactome)"
)

core_mapk <- short_names[c(
  "REACTOME_MAPK_TARGETS_NUCLEAR_EVENTS_MEDIATED_BY_MAP_KINASES",
  "BIOCARTA_MAPK_PATHWAY",
  "KEGG_MAPK_SIGNALING_PATHWAY"
)]

mapk_scores <- gsva_scores[names(short_names), , drop = FALSE] |>
  as.data.frame() |>
  rownames_to_column("pathway") |>
  mutate(pathway = short_names[pathway]) |>
  pivot_longer(-pathway, names_to = "sample", values_to = "score") |>
  mutate(
    sample_type = sample_type[match(sample, colnames(gsva_scores))],
    sample_type = factor(sample_type, levels = type_levels)
  )
```
## Figure S9G -- within-patient change at transformation
<!-- panels: S9G -->
Patients with both components sequenced -- the LUAD component and the transformed component of
the same tumour, or pre- and post-transformation biopsies -- give a paired design that controls
for inter-patient heterogeneity. 10 such pairs in the NE cohort, 8 in the squamous cohort.
```{r paired-data}
build_paired <- function(paired_ids, prefix_a, prefix_b, label_a, label_b, identity_pathways) {
  tibble(patient_id = paired_ids) |>
    mutate(
      sample_a = paste0(prefix_a, patient_id),
      sample_b = paste0(prefix_b, patient_id)
    ) |>
    filter(sample_a %in% colnames(gsva_scores), sample_b %in% colnames(gsva_scores)) |>
    pivot_longer(c(sample_a, sample_b), names_to = "component", values_to = "sample") |>
    mutate(histology = if_else(component == "sample_a", label_a, label_b)) |>
    crossing(pathway = c(names(short_names), identity_pathways)) |>
    mutate(
      gsva_score = map2_dbl(pathway, sample, \(p, s) gsva_scores[p, s]),
      pathway_label = case_when(
        pathway %in% names(short_names) ~ short_names[pathway],
        TRUE ~ paste0(pathway, " identity")
      )
    )
}

run_paired_test <- function(paired_df, label_a, label_b) {
  paired_df |>
    select(patient_id, histology, pathway_label, gsva_score) |>
    pivot_wider(names_from = histology, values_from = gsva_score) |>
    group_by(pathway_label) |>
    summarise(
      tidy(wilcox.test(.data[[label_a]], .data[[label_b]], paired = TRUE, conf.int = TRUE)),
      mean_diff = mean(.data[[label_a]] - .data[[label_b]]),
      .groups = "drop"
    ) |>
    add_padj() |>
    mutate(p_label = format_padj(p_adj))
}

# NE transformation: T-LUAD vs T-SCLC
tluad_samples <- colnames(gsva_scores)[str_detect(colnames(gsva_scores), "^T-LUAD")]
tsclc_samples <- colnames(gsva_scores)[str_detect(colnames(gsva_scores), "^T-SCLC")]
paired_ne_ids <- intersect(str_extract(tluad_samples, "\\d+"), str_extract(tsclc_samples, "\\d+"))

# Squamous transformation: T-LUAD vs T-LUSC
tlusc_samples <- colnames(gsva_scores)[str_detect(colnames(gsva_scores), "^T-LUSC")]
paired_sq_ids <- intersect(str_extract(tluad_samples, "\\d+"), str_extract(tlusc_samples, "\\d+"))

paired_ne <- build_paired(paired_ne_ids, "T-LUAD", "T-SCLC", "T-LUAD", "T-SCLC",
                          identity_pathways = c("LUAD", "SCLC"))
paired_sq <- build_paired(paired_sq_ids, "T-LUAD", "T-LUSC", "T-LUAD", "T-LUSC",
                          identity_pathways = c("LUAD", "LUSC"))
```
Each row of the panel is one of five pathways: the two lineage identities and the three core
MAPK signatures. P-values are paired Wilcoxon signed-rank, BH-adjusted across those five
comparisons within each cohort.
```{r paired-core}
pathway_order_ne_core <- c("LUAD identity", "SCLC identity", core_mapk)
pathway_order_sq_core <- c("LUAD identity", "LUSC identity", core_mapk)

paired_ne_core <- paired_ne |> filter(pathway_label %in% pathway_order_ne_core)
paired_sq_core <- paired_sq |> filter(pathway_label %in% pathway_order_sq_core)

ne_labels_core <- run_paired_test(paired_ne_core, "T-LUAD", "T-SCLC") |>
  mutate(pathway_label = factor(pathway_label, levels = pathway_order_ne_core))
sq_labels_core <- run_paired_test(paired_sq_core, "T-LUAD", "T-LUSC") |>
  mutate(pathway_label = factor(pathway_label, levels = pathway_order_sq_core))
```
```{r figs9g-paired-core-stacked}
#| fig-width: 5.9
#| fig-height: 3.9
# The transformation label becomes a right-side facet strip (row of facet_grid2);
# ggh4x::facet_grid2(independent = "y") keeps each pathway's own y-axis.
build_core_lineplot <- function(df, labels, order, x_levels, colors, trans_label) {
  df <- df |>
    mutate(pathway_label = factor(pathway_label, levels = order),
           histology = factor(histology, levels = x_levels),
           trans_label = trans_label)
  labels <- labels |>
    mutate(pathway_label = factor(pathway_label, levels = order),
           trans_label = trans_label)
  ggplot(df, aes(x = histology, y = gsva_score)) +
    geom_line(aes(group = patient_id), color = "grey60", linewidth = 0.35) +
    geom_point(aes(color = histology), size = 1.6, alpha = 0.85) +
    geom_text(data = labels, aes(label = p_label, x = 1.5, y = Inf),
              vjust = 1.4, size = 2.7, parse = TRUE, inherit.aes = FALSE) +
    ggh4x::facet_grid2(trans_label ~ pathway_label, scales = "free_y", independent = "y",
    strip = ggh4x::strip_vanilla(clip = "off")) +
    scale_y_continuous(expand = expansion(mult = c(0.04, 0.26))) +
    scale_x_discrete(expand = expansion(mult = c(0.28, 0.28))) +
    coord_cartesian(clip = "off") +
    scale_color_manual(values = colors, guide = "none") +
    labs(x = NULL, y = "GSVA score") +
    theme_few() +
    theme(strip.text.x = element_text(size = 8, vjust = 0),
          strip.text.y = element_text(size = 8.5, angle = -90),
          strip.clip = "off",
          axis.title.y = element_text(size = 9),
          axis.text.x = element_text(size = 8, angle = 25, hjust = 1),
          axis.text.y = element_text(size = 7),
          plot.margin = margin(t = 2, r = 3, b = 1, l = 2))
}

p_ne_core <- build_core_lineplot(
  paired_ne_core |> mutate(pathway_label = as.character(pathway_label)),
  ne_labels_core, pathway_order_ne_core, c("T-LUAD", "T-SCLC"),
  c("T-LUAD" = "#5D3A9B", "T-SCLC" = "#1B9E77"), "SCLC\ntransformation\n(n = 10 pairs)")

p_sq_core <- build_core_lineplot(
  paired_sq_core |> mutate(pathway_label = as.character(pathway_label)),
  sq_labels_core, pathway_order_sq_core, c("T-LUAD", "T-LUSC"),
  c("T-LUAD" = "#5D3A9B", "T-LUSC" = "#D95F02"), "LUSC\ntransformation\n(n = 8 pairs)")

p_core_stacked <- p_ne_core / p_sq_core
p_core_stacked
ggsave(file.path(plot_dir, "paired_core_stacked.pdf"), p_core_stacked,
       width = 5.9, height = 3.9)
```
## Figure S9D -- LUAD identity against MAPK activity
<!-- panels: S9D -->
Every sample in both cohorts, correlating the LUAD identity score with each of the three core
MAPK scores. Spearman, BH-adjusted across the three panels.
```{r build-correlation-data}
identity_pathways <- c("LUAD", "LUSC", "SCLC")

identity_wide <- gsva_scores[identity_pathways, , drop = FALSE] |>
  as.data.frame() |>
  rownames_to_column("identity_pathway") |>
  pivot_longer(-identity_pathway, names_to = "sample", values_to = "score") |>
  mutate(
    sample_type = sample_type[match(sample, colnames(gsva_scores))],
    sample_type = factor(sample_type, levels = type_levels)
  ) |>
  pivot_wider(names_from = identity_pathway, values_from = score)

mapk_wide <- mapk_scores |>
  mutate(pathway = unname(pathway)) |>
  select(sample, pathway, score) |>
  pivot_wider(names_from = pathway, values_from = score)

scores_wide <- identity_wide |>
  left_join(mapk_wide, by = "sample") |>
  mutate(transformed = if_else(str_detect(as.character(sample_type), "^T-"), "T-", "Non-T"))
```
```{r figs9d-luad-vs-mapk-scatter}
#| fig-width: 6.2
#| fig-height: 2.6
scores_luad_mapk <- scores_wide |>
  select(sample, sample_type, transformed, LUAD, all_of(unname(core_mapk))) |>
  pivot_longer(all_of(unname(core_mapk)), names_to = "mapk_pathway", values_to = "mapk_score") |>
  mutate(mapk_pathway = factor(mapk_pathway, levels = core_mapk))

luad_cor_labels <- scores_luad_mapk |>
  group_by(mapk_pathway) |>
  summarise(
    tidy(cor.test(LUAD, mapk_score, method = "spearman")),
    .groups = "drop"
  ) |>
  add_padj() |>
  mutate(
    cor_label = sprintf("rho==%.2f", estimate),
    p_label = format_padj(p_adj)
  )

ggplot(scores_luad_mapk, aes(x = LUAD, y = mapk_score, color = sample_type)) +
  geom_point(size = 2, alpha = 0.8) +
  geom_smooth(aes(group = 1), method = "lm", se = TRUE, color = "grey30", linewidth = 0.5) +
  geom_text(data = luad_cor_labels, aes(label = cor_label, x = Inf, y = -Inf),
            hjust = 1.08, vjust = -1.8, size = 3.1, parse = TRUE, inherit.aes = FALSE) +
  geom_text(data = luad_cor_labels, aes(label = p_label, x = Inf, y = -Inf),
            hjust = 1.06, vjust = -0.8, size = 2.9, parse = TRUE, inherit.aes = FALSE) +
  facet_wrap(~ mapk_pathway, nrow = 1) +
  coord_cartesian(clip = "off") +
  scale_color_brewer(palette = "Paired") +
  labs(
    x = "LUAD identity score (GSVA)",
    y = "MAPK pathway score\n(GSVA)",
    color = "Group",
    title = "n = 72 bulk RNA-seq samples"
  ) +
  theme_few() +
  guides(color = guide_legend(override.aes = list(size = 2))) +
  theme(strip.text = element_text(size = 9, vjust = 0),
        plot.title = element_text(size = 11),
        plot.margin = margin(t = 2, r = 2, b = 2, l = 2),
        axis.title = element_text(size = 10),
        axis.text = element_text(size = 8),
        panel.spacing = unit(3, "pt"),
        legend.position = "right",
        legend.box.spacing = unit(4, "pt"),
        legend.key.height = unit(0.8, "lines"),
        legend.key.width = unit(0.7, "lines"),
        legend.title = element_text(size = 9),
        legend.text = element_text(size = 8))
ggsave(file.path(plot_dir, "luad_vs_mapk_scatter.pdf"), width = 6.2, height = 2.6)
```